Designing reports
A report template describes the layout and content of the report. The Scrivo report template designer helps you to design your report templates, providing a view of all your data items with easy drag-and-drop to add data into the template:
- Drop a data item onto your template
- Adjust the item's format and properties
- Preview to see how your report will look
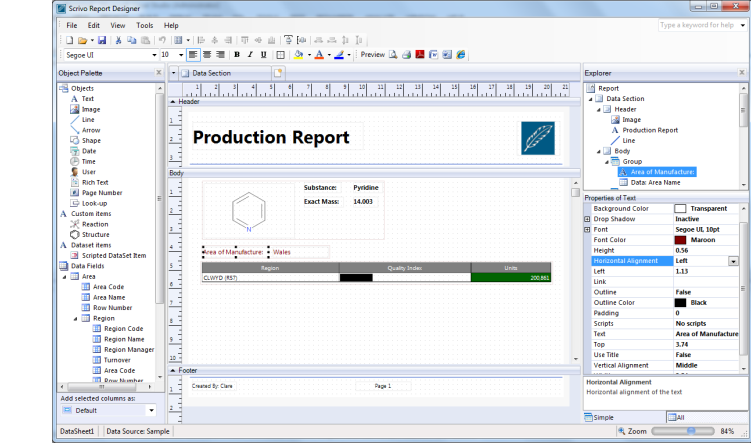
The template designer shows you all the properties of each report item, so you can control exactly how each item appears in your report. Here's a selection:
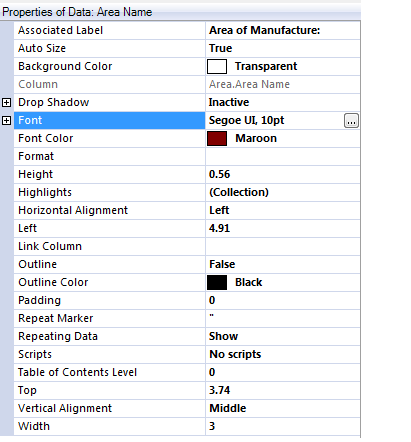
- Background colour
- A fill colour for the background of the item, can be transparent
- Horizontal and vertical alignment
- Controls the positioning of the data within the item's bounds
- Repeat marker and repeat data handling
- Options for handling repeating data, including hiding the second and subsequent occurrences, or replacing them with a given marker
- Outline and outline colour
- Options for adding a border to the item
- Table of contents level
- Where to include this item in a table of contents. Learn more
- Link column
- Optionally identifies a column containing a hyperlink target, so this item can be a live jump
- Scripts
- Scripts for formatting or rendering this item. See Customisation for more details
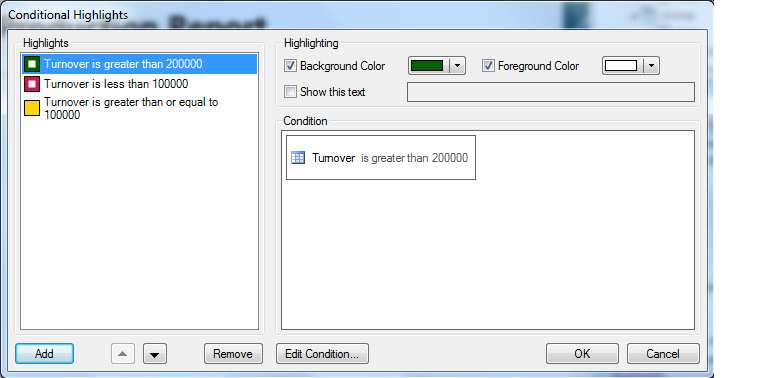
- Highlights
- A collection of conditions on the data, with formatting options to highlight data that
fulfills the condition. For example, you could highlight in red any values above 100, with values below 50 highlighted in green. Learn more
Groups of report items also have properties you can use to control the 'flow' of your report:
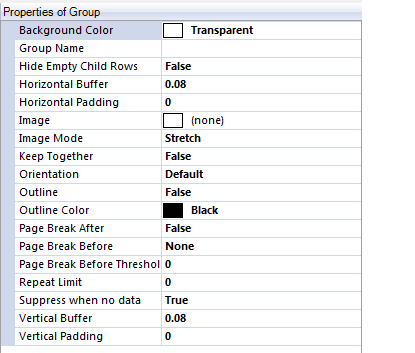
- Keep together
- Indicates that the group should never be split across pages
- Orientation
- Can switch the orientation between portrait and landscape before a group is rendered. This is useful
for groups containing data that is naturally wide, or a group containing a table with many columns.
- Page Break Before or After
- Identifies where a page break might be forced, including when the group is within
a certain threshold of the bottom of the page
- Suppress when no data
- Can be used to suppress the group entirely when all the data items are empty
- Repeat limit
- Controls the maximum number of repeats of the group the report will contain. This is useful for 'top 5' type reports.
Table of contents
Your report can include a table of contents with live jumps to the page on which each data value occurs:
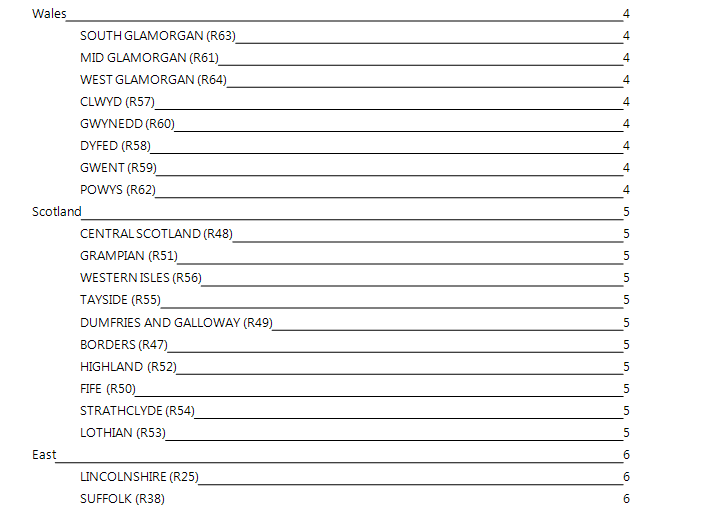
Simply set the 'Table of contents level' property for each data item to control its inclusion in the table of contents.
Setting
multiple levels gives a hierarchical table of contents as shown: Wales, Scotland and East are level 1, whereas each region is level 2.
Even specialized
data and images can appear in the table of contents.
The table of contents can appear at the start of report, or you can choose to place it at the end as an 'index'.
Conditional highlighting
Conditional highlightling allows you to highlight any noteworthy data in your report: